Cloud Native Observability with WSO2 Micro Integrator
Feb 6, 2021 · 7 minute read · CommentsWSO2EIMonitoringObservability
In a distributed systems environment, troubleshooting and debugging are critical and also very challenging tasks. WSO2 Micro Integrator offers the possibility to integrate with cloud native monitoring tools in order to provide a comprehensive observability solution with: log monitoring, message tracing and metrics monitoring.
With WSO2 MI we have two approaches to deal with observability:
- The classic: WSO2 EI Analytics and Log4j
- Cloud Native: Fluentbit, Loki, Jaeger, Prometheus and Grafana
In this post, we will show a simple setup of a cloud native observability solution in a Kubernetes Environment.
For such, we will leverage the helm charts available in the observability-ei github repository. This repo contains helm charts to deploy both of the classic and cloud native observability for MI.
As the basis for this post we used the documentation provided at the ei docs.
Configuring the Cloud Native Observability Stack
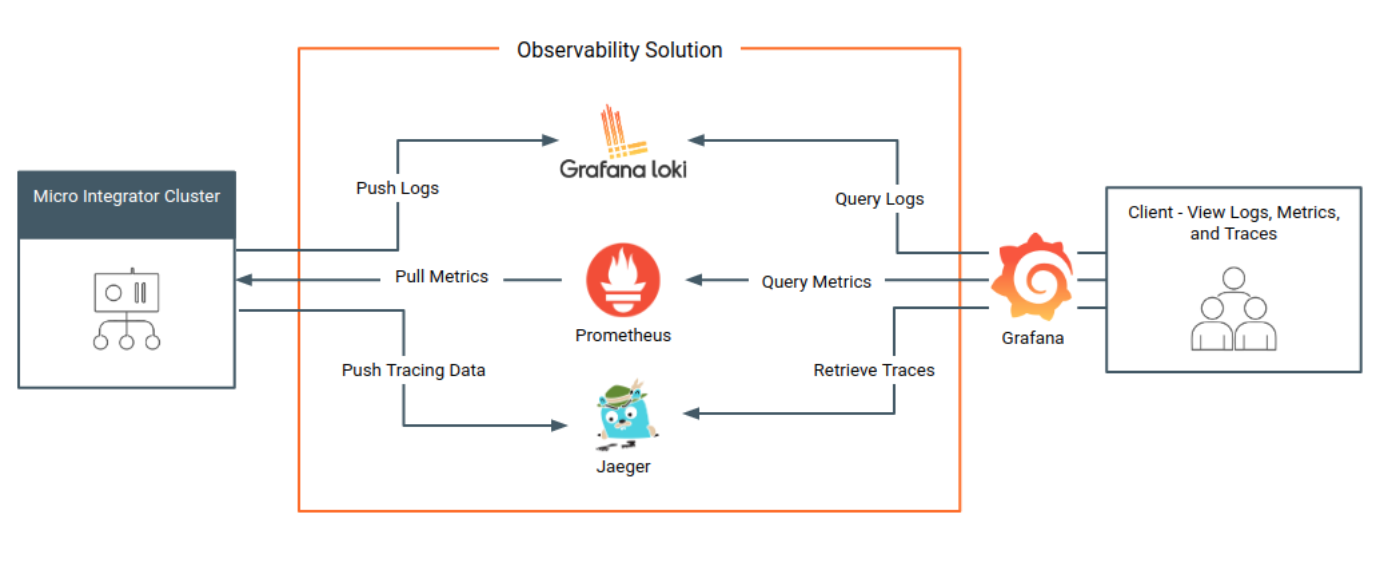
In the image below, taken from the WSO2 docs, we can see the observability solution we will configure and the tools used into it:

For installing those tools in k8s, we will use the helm charts from the repository mentioned in the section above. In a terminal, we can use the git command below to checkout the repository:
git clone https://github.com/wso2/observability-ei.git
And then, go to the cloud-native directory:
cd observability-ei/cloud-native
In order to execute a simple installation, we just need to install the helm chart, but before doing that, we will change some parameters in the values.yaml file.
Update the Prometheus Service Port
By default prometheus set the servicePort to be 80, we will change it to be 8088, by adding the config entry servicePort under prometheus -> server
  ...
  server:
    service:
      type: LoadBalancer
      servicePort: 8088
  ...
We changed that because we will use the port 80 it later for another component. Now prometheus is ok. Let us move to the grafana component.
Configure Grafana
For Grafana, we will do two changes:
Update the Service Port
We will change the service port to be 9080, by using property port under grafana -> service like below:
  enabled: true
  service:
    type: LoadBalancer
    port: 9080
This will be the port we will use to access the Grafana UI.
Update Prometheus Datasource URL
In the grafana configurations we have the datasources settings and one of them is for Prometheus. As we changed the servicePort of Prometheus to be 8088, we need to append the port in the url for the datasource like below:
- name: Prometheus
  type: prometheus
  url: http://{{ .Release.Name }}-prometheus-server:8088
  access: proxy
  isDefault: true
With those configurations Grafana is ready for use.
Configure Loki stack
For Loki stack configurations, we will do the changes below:
Enable it by changing the enable flag to true
loki-stack:
  enabled: true
Change the deployment label and namespace loki will monitor
In our example we will change the label app to wso2mi and the namespace_name to default
...
labels:
  app: wso2mi
  release: release
namespace_name: default
...
Enable promtail
We do this by setting the enable flag to true:
promtail:
  enabled: true
With that, let us now move to Jaeger.
Enable Jaeger
We need to enable Jaeger for message tracing, by setting the enable flag to true. By doing this, it will install the Jaeger Operator in the cluster, then later we need to create a Jaeger instance to receive the message tracing information
jaeger:
  enabled: true
Install the observability stack
After doing the configurations above, we can install the observability stack into our Kubernetes cluster by running the command below inside the observability-ei/cloud-native folder:
helm install wso2-observability . --render-subchart-notes
After this we will be able to access Prometheus UI using the URL below:
http://localhost:8088/graph
We are using localhost, because we are deploying it at a Docker for Desktop Kubernetes local cluster.
We can access Grafana UI by using:
http://localhost:9080/
The username that needs to be used is admin and in order to get the password we can run the command below:
kubectl get secret --namespace default wso2-observability-grafana -o jsonpath="{.data.admin-password}" | base64 --decode ; echo
Now let us install a Jaeger Instance.
Install a Jaeger Instance
As said before, now we have the Jaeger operator installed and we need to install an instance. For that, we will use the simplest deployment and we will specify that it will use an ingress controller. We can see the Jaeger definition below:
apiVersion: jaegertracing.io/v1
kind: Jaeger
metadata:
  name: wso2-observability
spec:
  ingress:
    enabled: true
    annotations:
      kubernetes.io/ingress.class: nginx
Then, we can run the command below:
kubectl apply -f jaeger-simplest.yaml
After the pods are up and running, we will be able to access Jaeger UI by using the url:
http://localhost/search
As it uses an ingress, we need to install the NGINX Ingress Controller before creating the Jaeger instance.
With the above configurations made, we now have the observability tools installed and configured to be used. Below we will configure the WSO2 MI deployment for kubernetes.
Configure the WSO2 Micro Integrator Kubernetes Deployment
In order to enable the Prometheus Monitoring and Jaeger observability for the MI deployment, it is needed to add some settings in the deployment.toml and also in the kubernetes definition. Let us start with the deployment.toml
deployment.toml changes for the monitoring and tracing
For the prometheus metrics, we need to add the following handler:
[[synapse_handlers]]
name="CustomObservabilityHandler"
class="org.wso2.micro.integrator.observability.metric.handler.MetricHandler"
For the jaeger tracing, we need to enable the message tracing and also the jaeger configurations:
[mediation]
flow.statistics.capture_all= true
stat.tracer.collect_payloads= true
stat.tracer.collect_mediation_properties= true

[opentracing]
enable = true
logs = true
jaeger.sampler.manager_host = "wso2-observability-agent"
jaeger.sender.agent_host = "wso2-observability-agent"
In the above configurations, we are using the k8s service name for the Jaeger agent as the target server for the WSO2 MI to send the traces to.
As we will work in a kubernetes environment, we need to either bake this deployment.toml into the docker image or mount it as a ConfigMap in the k8s deployment.
Configure the k8s deployment specification
For the metrics monitoring and for the log parsing through fluentbit, we need to add the following annotations in the deployment:
prometheus.io.wso2/scrape: "true"
prometheus.io.wso2/port: "9201"
prometheus.io.wso2/path: /metric-service/metrics
fluentbit.io/parser: wso2
And, we need to add the following Java System Property to enable the Prometheus Metrics APIs:
- name: JAVA_OPTS
  value: "-DenablePrometheusApi=true
And we need to specify the following labels to be used in Loki log monitoring:
...
template:
    metadata:
      labels:
        app: wso2mi
        release: release
...
With those configurations in the k8s deployment, we can deploy the application into the kubernetes cluster, and also, make some requests to the API/Service deployed.
Verify the setup
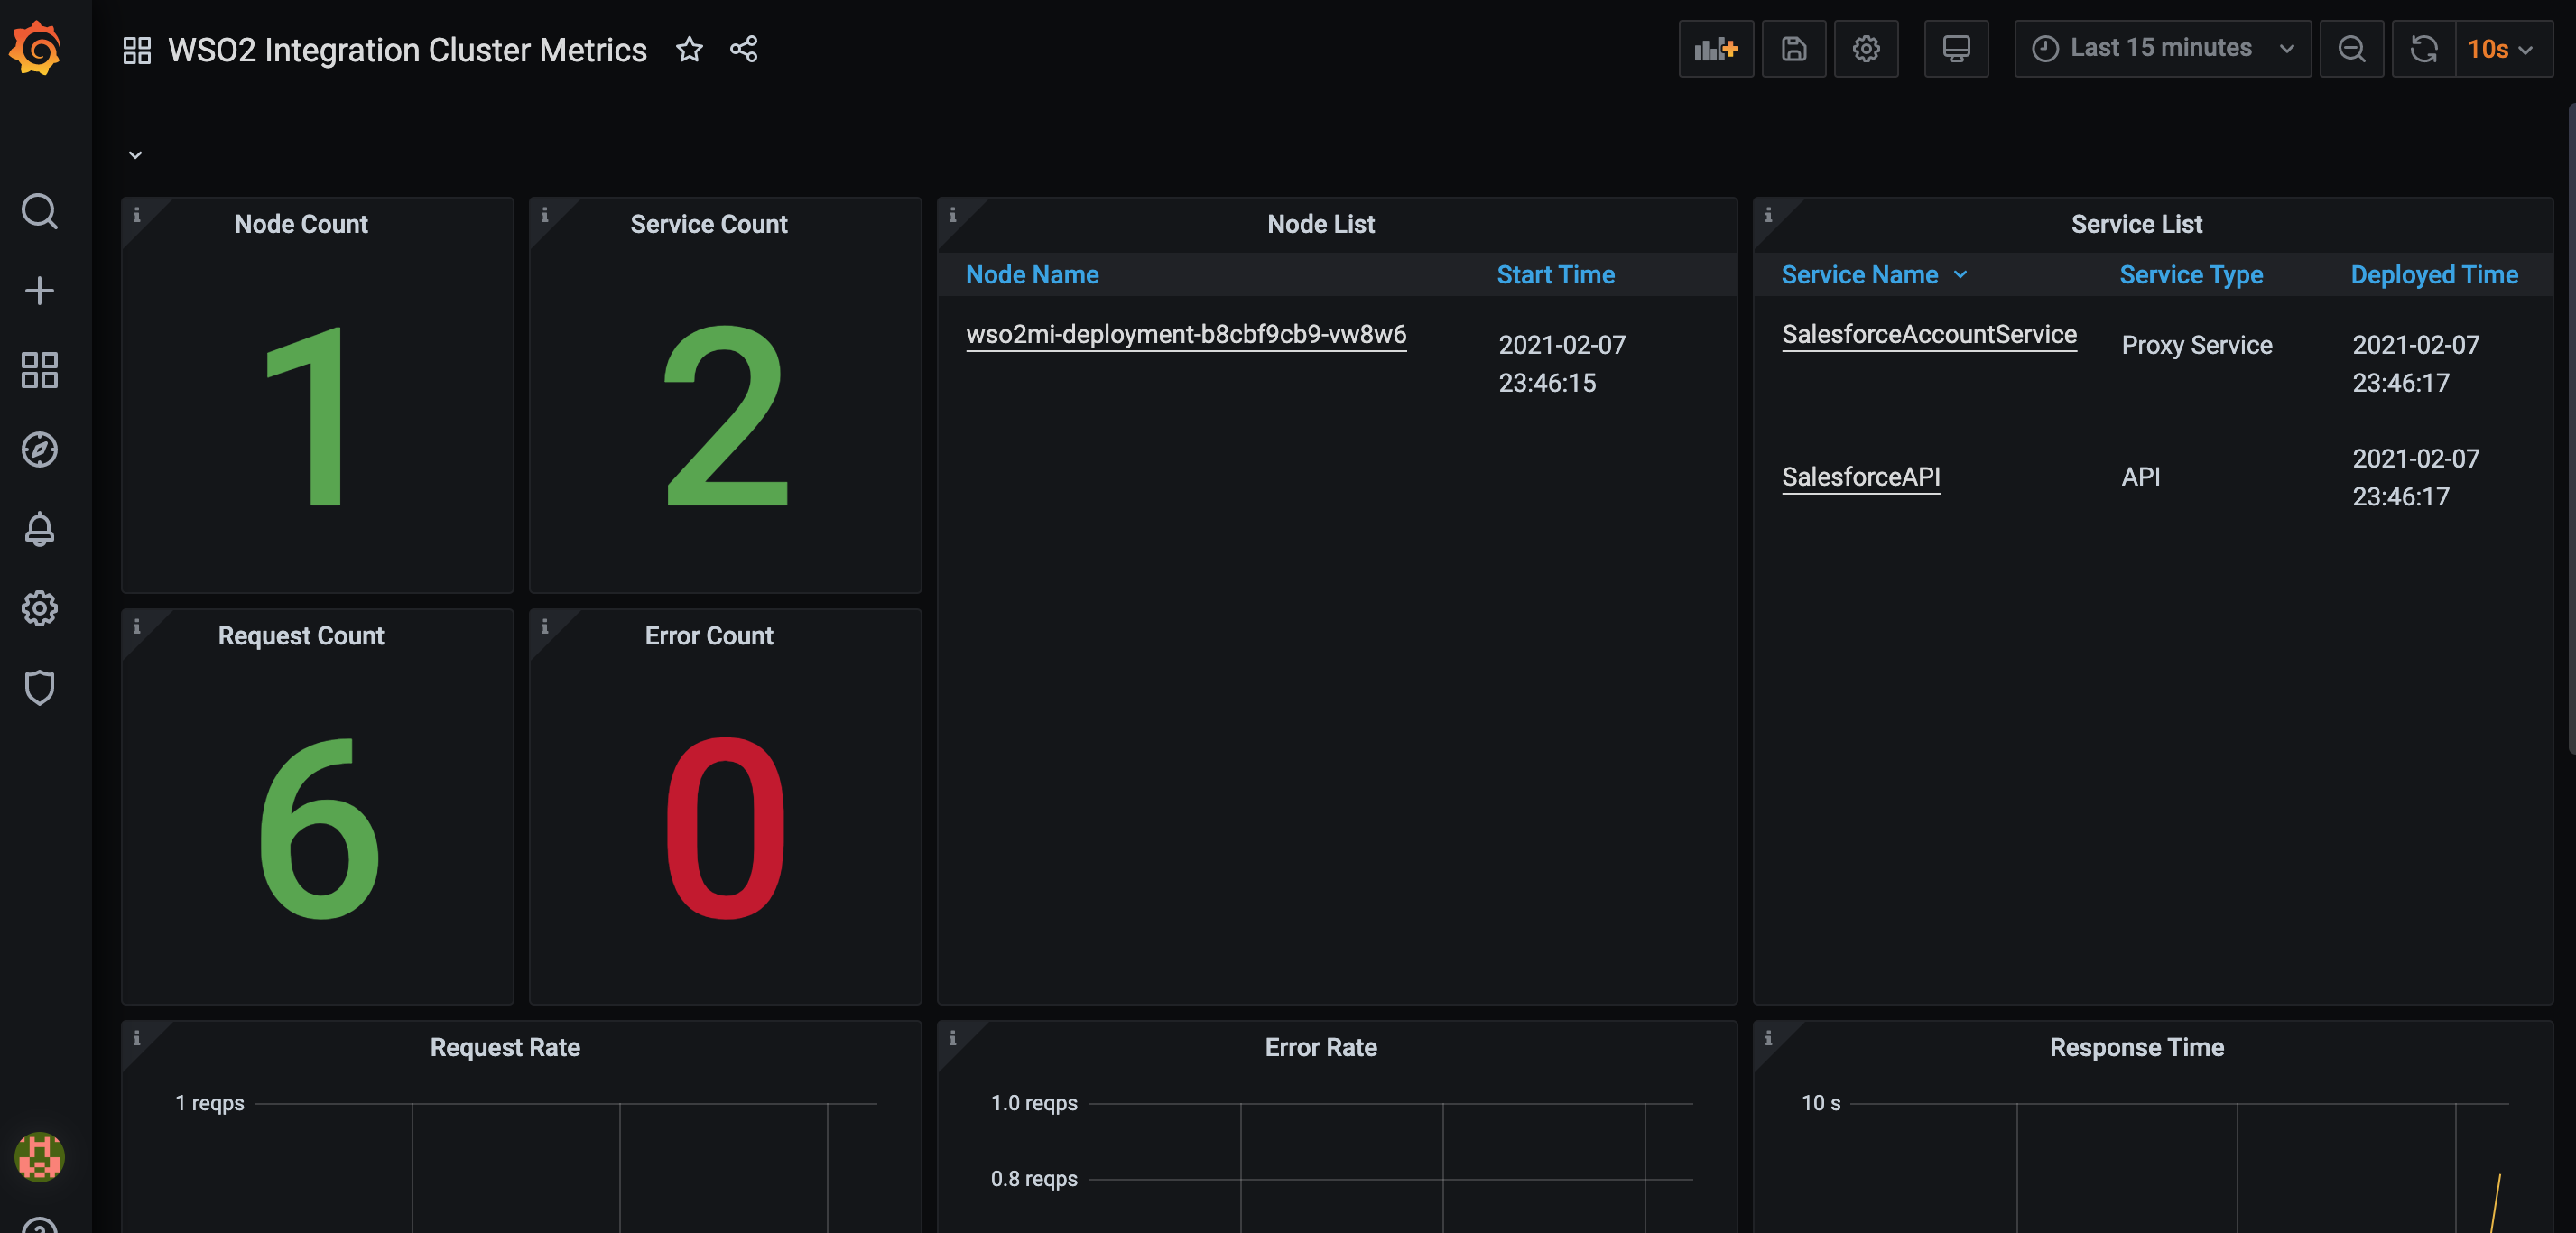
If everything is properly setup, we can now check the Integration Cluster Dashboard and it should contain the number of PODs that were specified in the k8s definition like below:

In the logs panel it should not be displaying any content as we need to specify which datasource and Label we will use. For that, we need to click in the Edit option, and then choose:
- Datasource: Loki
- Log Labels: app > wso2mi

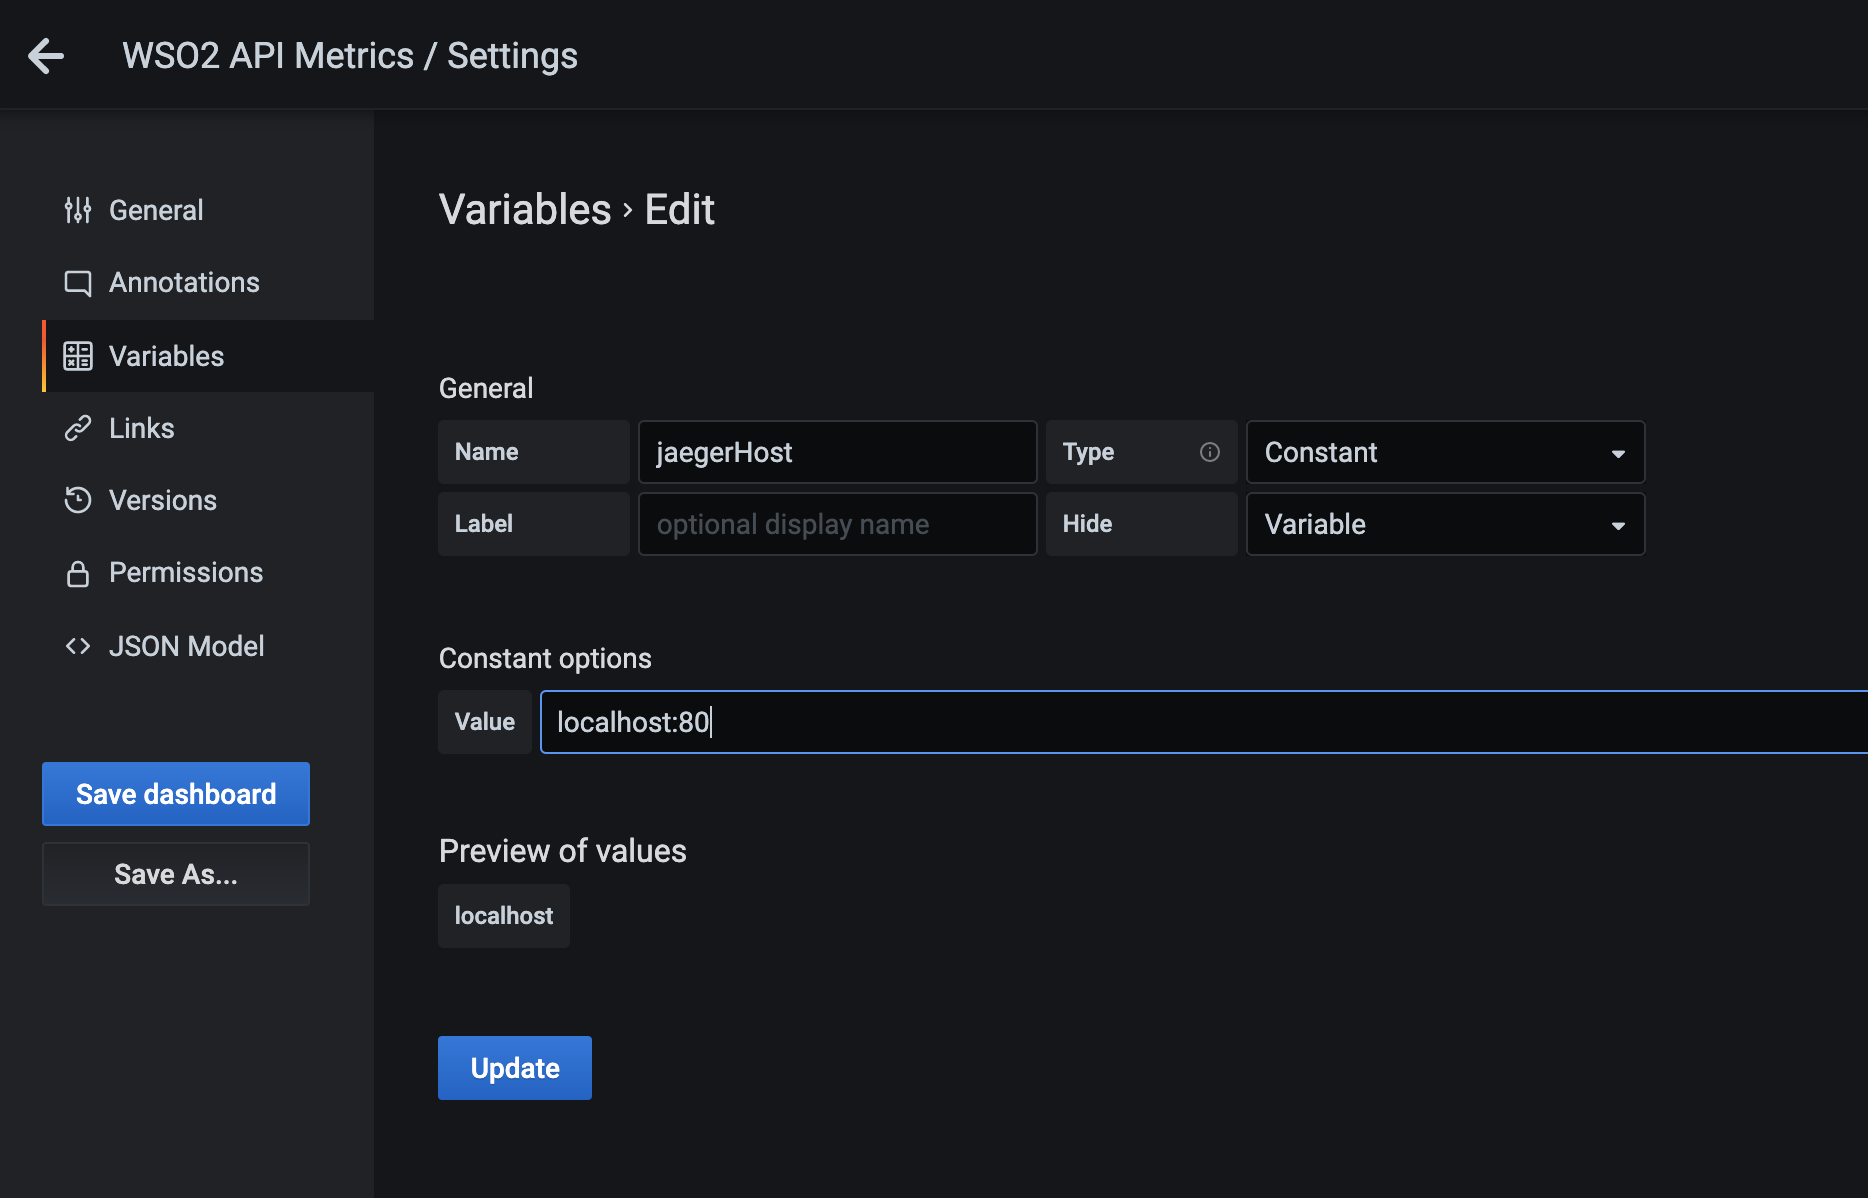
With these panels we can see the integration with Prometheus and Loki. For checking the Jaeger traces we need to go to the API or Services Metrics Dashboard. In the Response Time panel there is an “i” icon with a link to the Jaeger Console. In order to make it work, we need to specify the Jaeger URL in the dashboard configuration. When we go to the Dashboard configuration, there is a section for variables, then we need to update the Jaeger Host var:

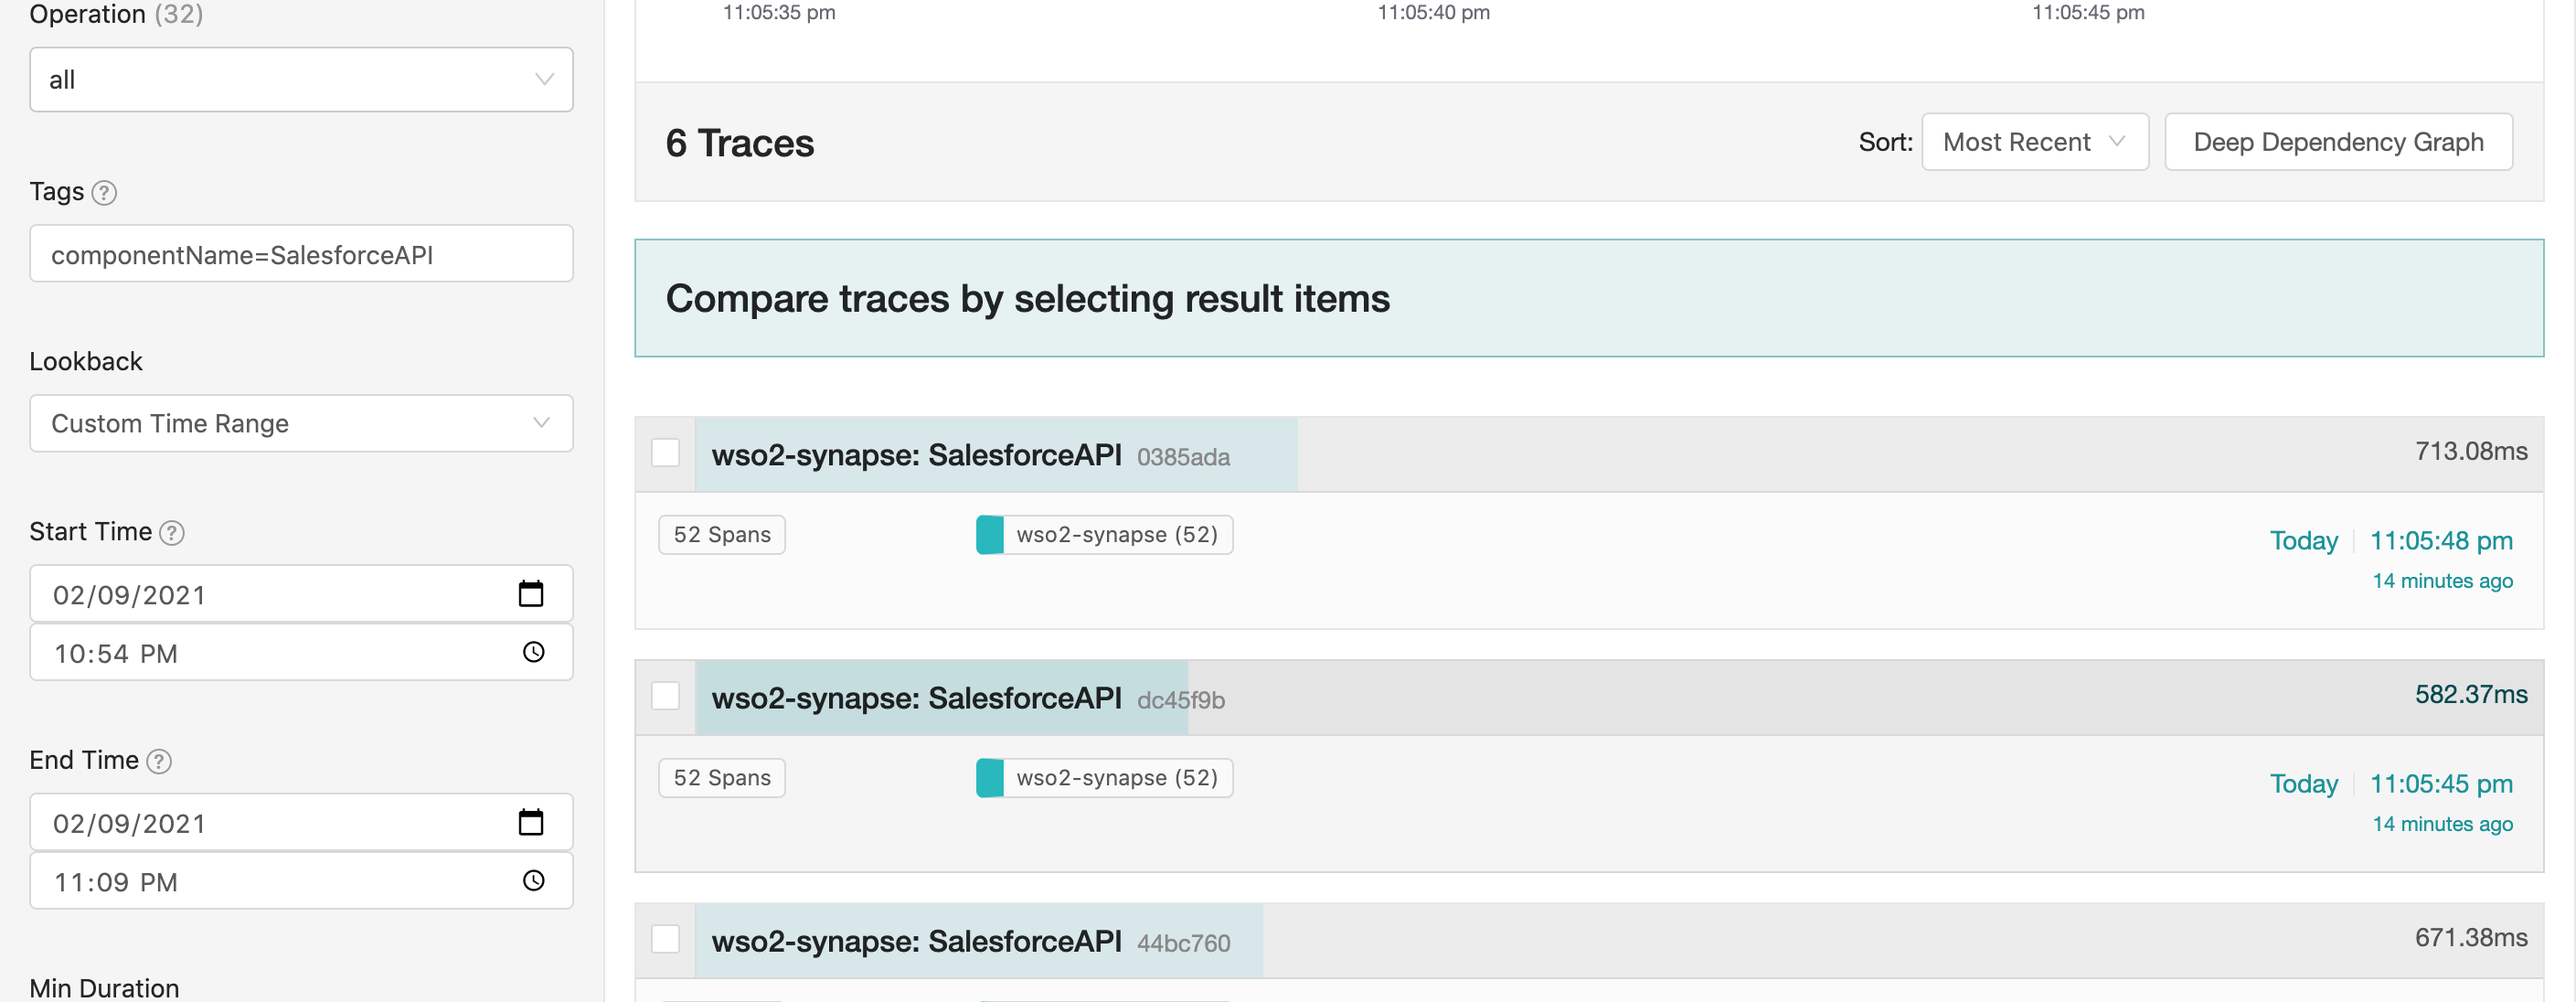
After updating it, we can now click in the icon to check the tracing information for the API calls

Conclusion
In this post we showed a simple way to setup a Cloud Native Observability Solution for WSO2 Micro Integrator. Along with other tools we have ways to monitor the solution, and quickly identify which component in the solution is having problems.
By leveraging such solutions we can have more confidence in delivering, monitoring and maintaining Cloud Native applications developed with WSO2 Micro Integrator.
I hope this helps! See you in the next post.